Projects / Understanding an emerging hazard: rock glacier destabilization
Understanding an emerging hazard: rock glacier destabilization
In 2015 a debris flow was triggered on a rock glacier front in the French Alps. What followed was a jointed effort between researchers and practitioners to understand whether climate change was disrupting these landforms.
Some of the deliverables produced by the project. The PFI (Permafrost Favorability Index Map) describes those areas where permafrost is likely to exist. The susceptibility map on the other hand pins areas where topography and climate meet to create the conditions that likely cause a rock glacier to behave like a landslide. The site-scale data show rock glacier velocities over different periods, computed by feature-tracking time-lapse orthoimagery. Notable sites are observable through actual orthoimage time-lapse.
The trigger: Col du Lou, August 2015
On August 15, 2015, a debris flow originated from the front of the Lou rock glacier above Lanslevillard, in the Maurienne valley. The flow reached the valley floor, flooded part of the village, and forced emergency response. The event was unusual at the source: a rock glacier that had been accelerating for decades without systematic monitoring, in terrain where the relationship between creep dynamics and debris flow hazard was not expected.
The event focused attention on a gap. The French Alps had no systematic inventory of which rock glaciers were at elevated hazard, no regional map of where permafrost was likely present, and no long-term kinematic dataset to detect trends. This research programme was built to close those gaps, working outward from the site scale to the regional scale.
Regional permafrost mapping (2015-2017)
Permafrost cannot be directly observed at regional scale. What can be mapped in large numbers are rock glaciers: creeping masses of ice-cemented debris that require permafrost to form and persist. Their presence signals past or present permafrost conditions; their activity status signals whether permafrost is still there today.
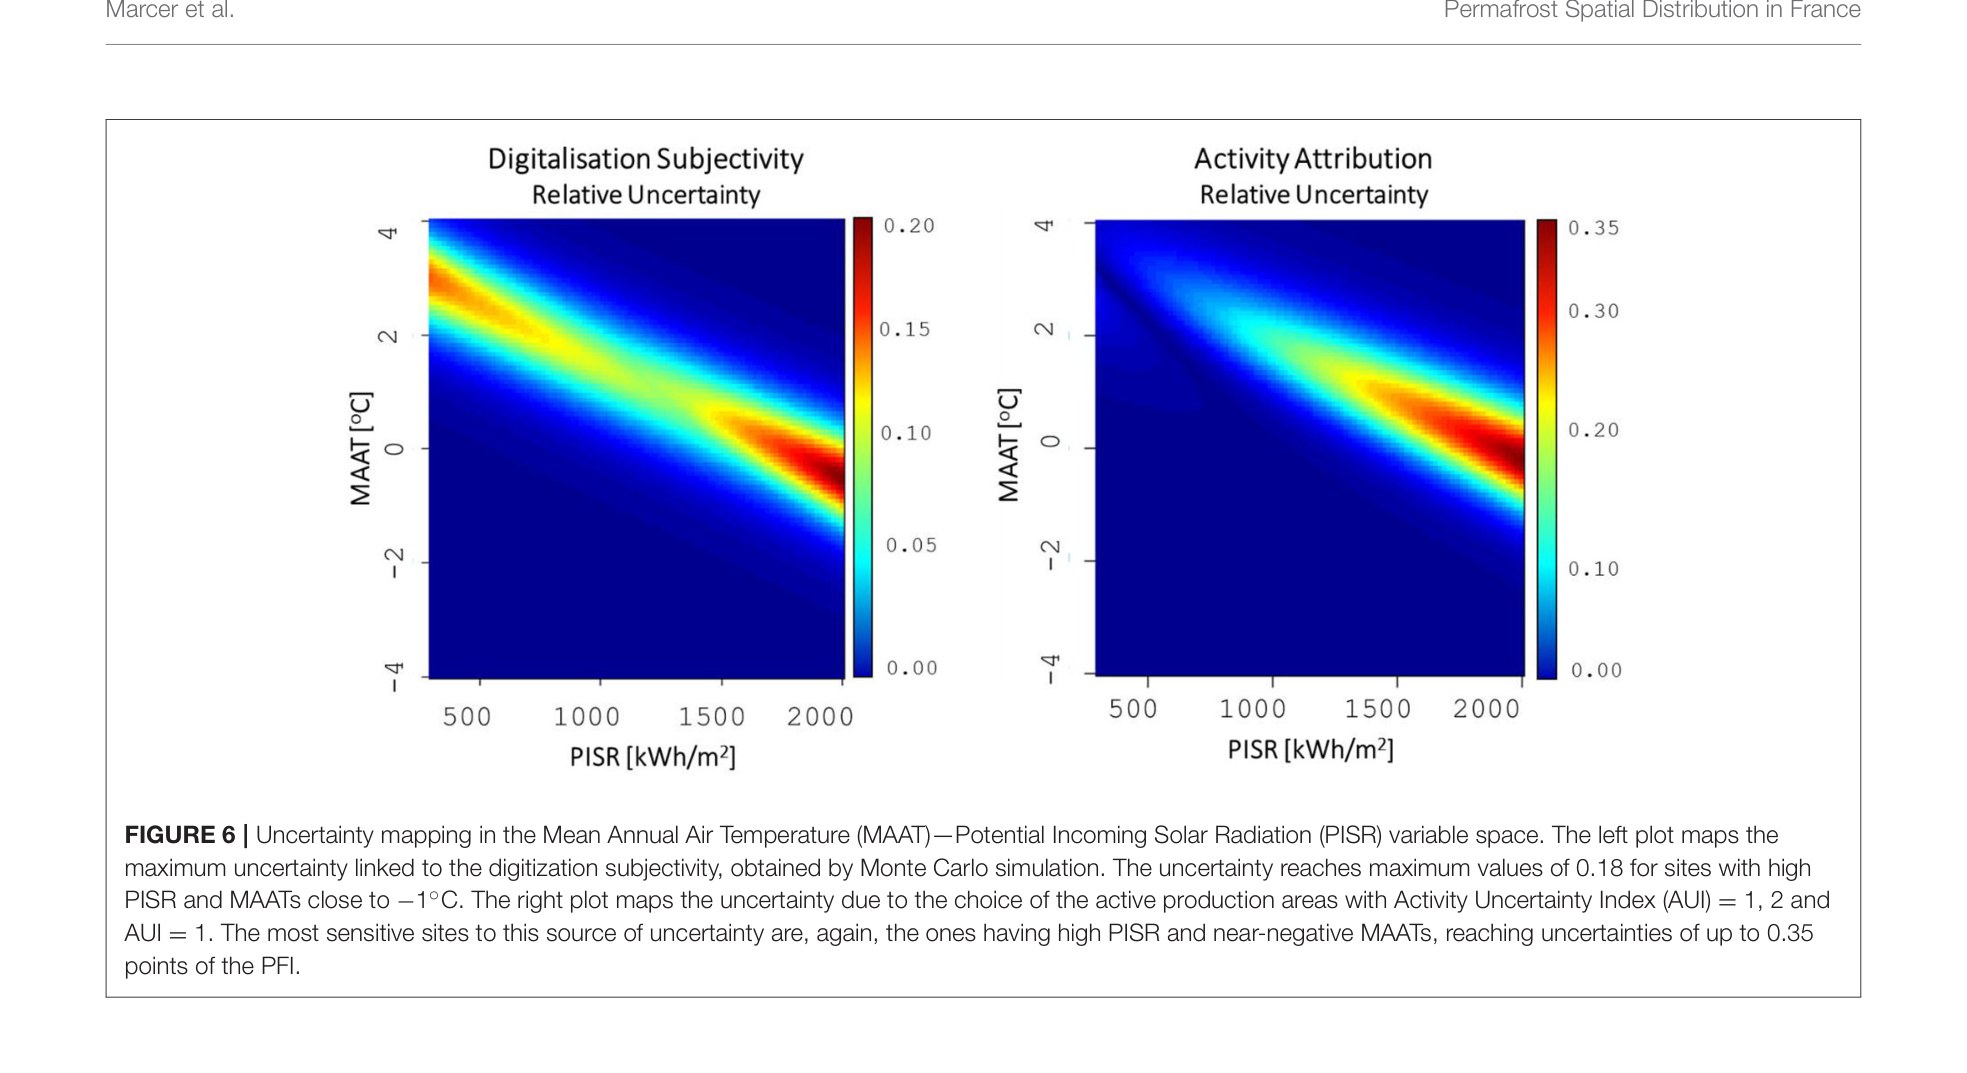
The rock glacier inventory across the entire French Alps was about to be completed: over 3,000 landforms classified manually from aerial photographs and orthophotos. Activity classification (active, inactive, relict) relied on geomorphological indicators. This novel data source was fed inot a logistic regression model trained on two climatic predictors: Mean Annual Air Temperature (MAAT) and Potential Incoming Solar Radiation (PISR). The output is the Permafrost Favorability Index (PFI): a continuous 0-1 raster at 25 m resolution covering the entire French Alps, visible in the map above.
Destabilization susceptibility (2016-2019)
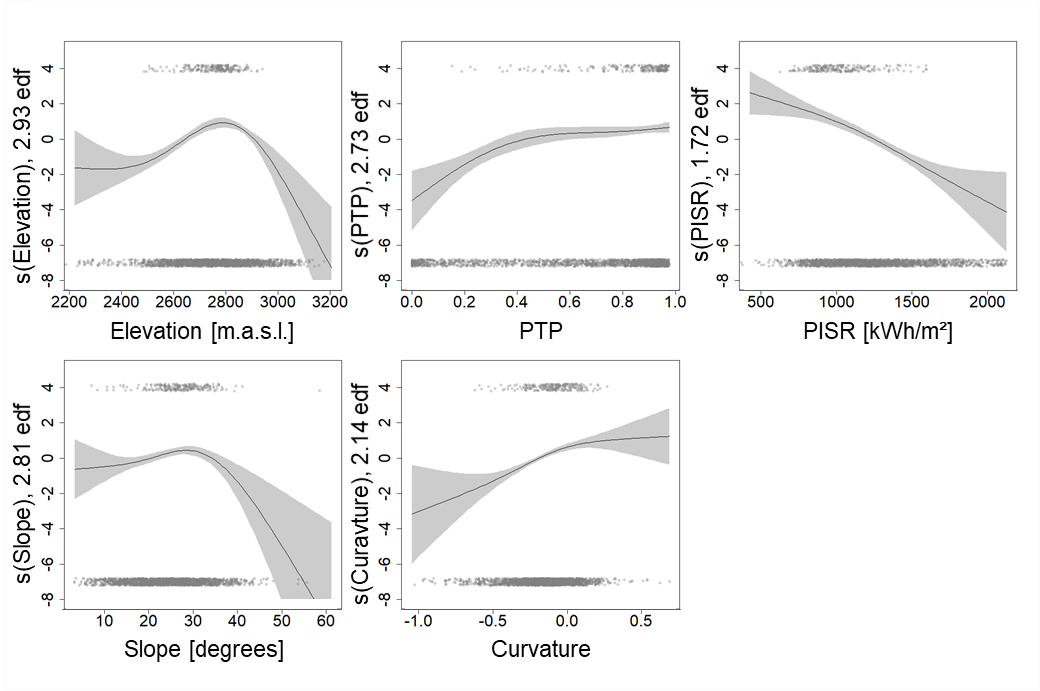
Rock galcier destabilization is the transition from slow creep to rapid, fracture-controlled movement; this is the process that predisposed the Col du Lou failures. To bridge permafrost map with potential hazard, it is necessary to understand how this process happens, as it requires a specific combination of slope gradient, surface geometry, aspect, and cumulative warming history.
A machine learning model was trained and validated against an inventory of already-destabilized landforms. The response curves show the empirical relation between destabilization, climate and terrain, allwoing to map destabilization susceptibility at large scale, focusing the search for hazardous landforms.
Kinematics at scale (2017-2021)
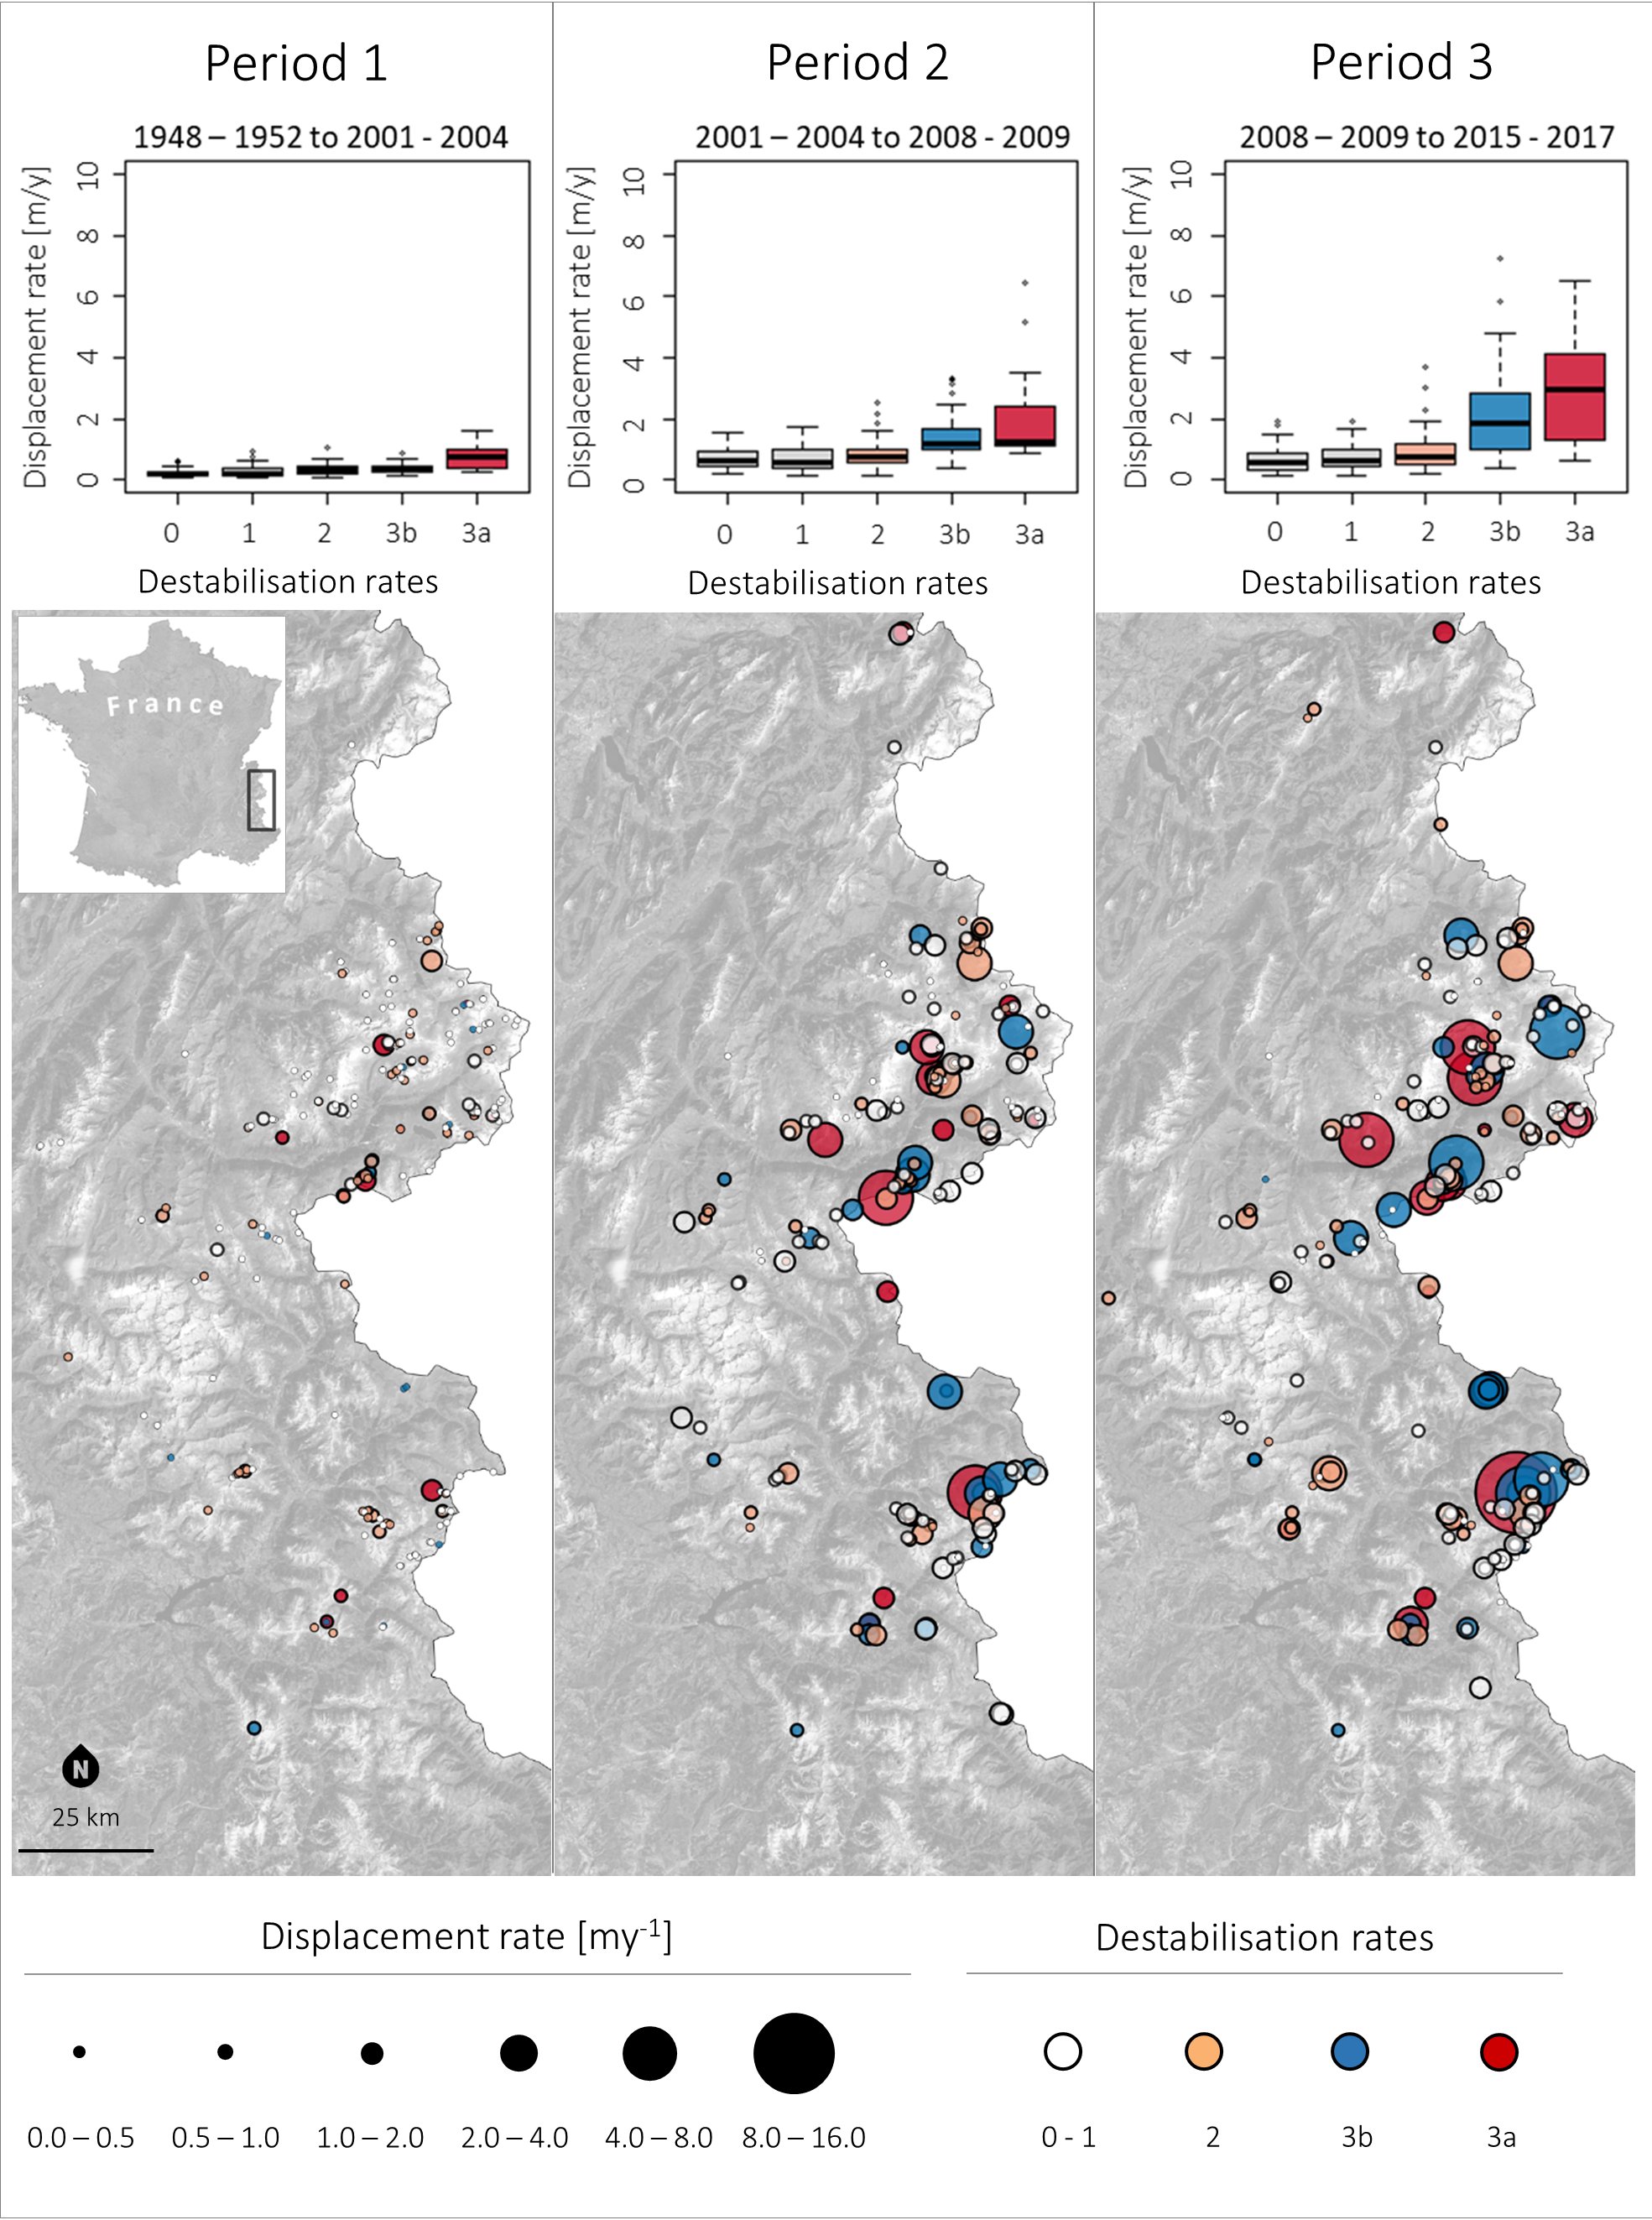
The susceptibility model predicted which landforms were at risk. The kinematic dataset measured what actually happened. Surface displacement was extracted from co-registered orthophoto pairs at decadal intervals across 94 rock glaciers from 1945 to 2018 - 73 years of data, manually tracked from archival imagery spanning multiple sensors, scales, and seasons. The 16 monitored sites visible on the map represent the subset with complete multi-epoch archives.
Pierre Brune in the Vanoise massif is the most documented site: near-zero displacement from 1945 to the mid-1980s, then a clear step-change. The downslope zone accelerated from roughly 1 m/year in the early 1990s to over 6 m/year by 2017-2018. The spatial pattern is textbook destabilization: the landform has different kinematic behaviours at the root (creep) and the front (sliding). Between the two, deep crevasses cut the permafrost body.
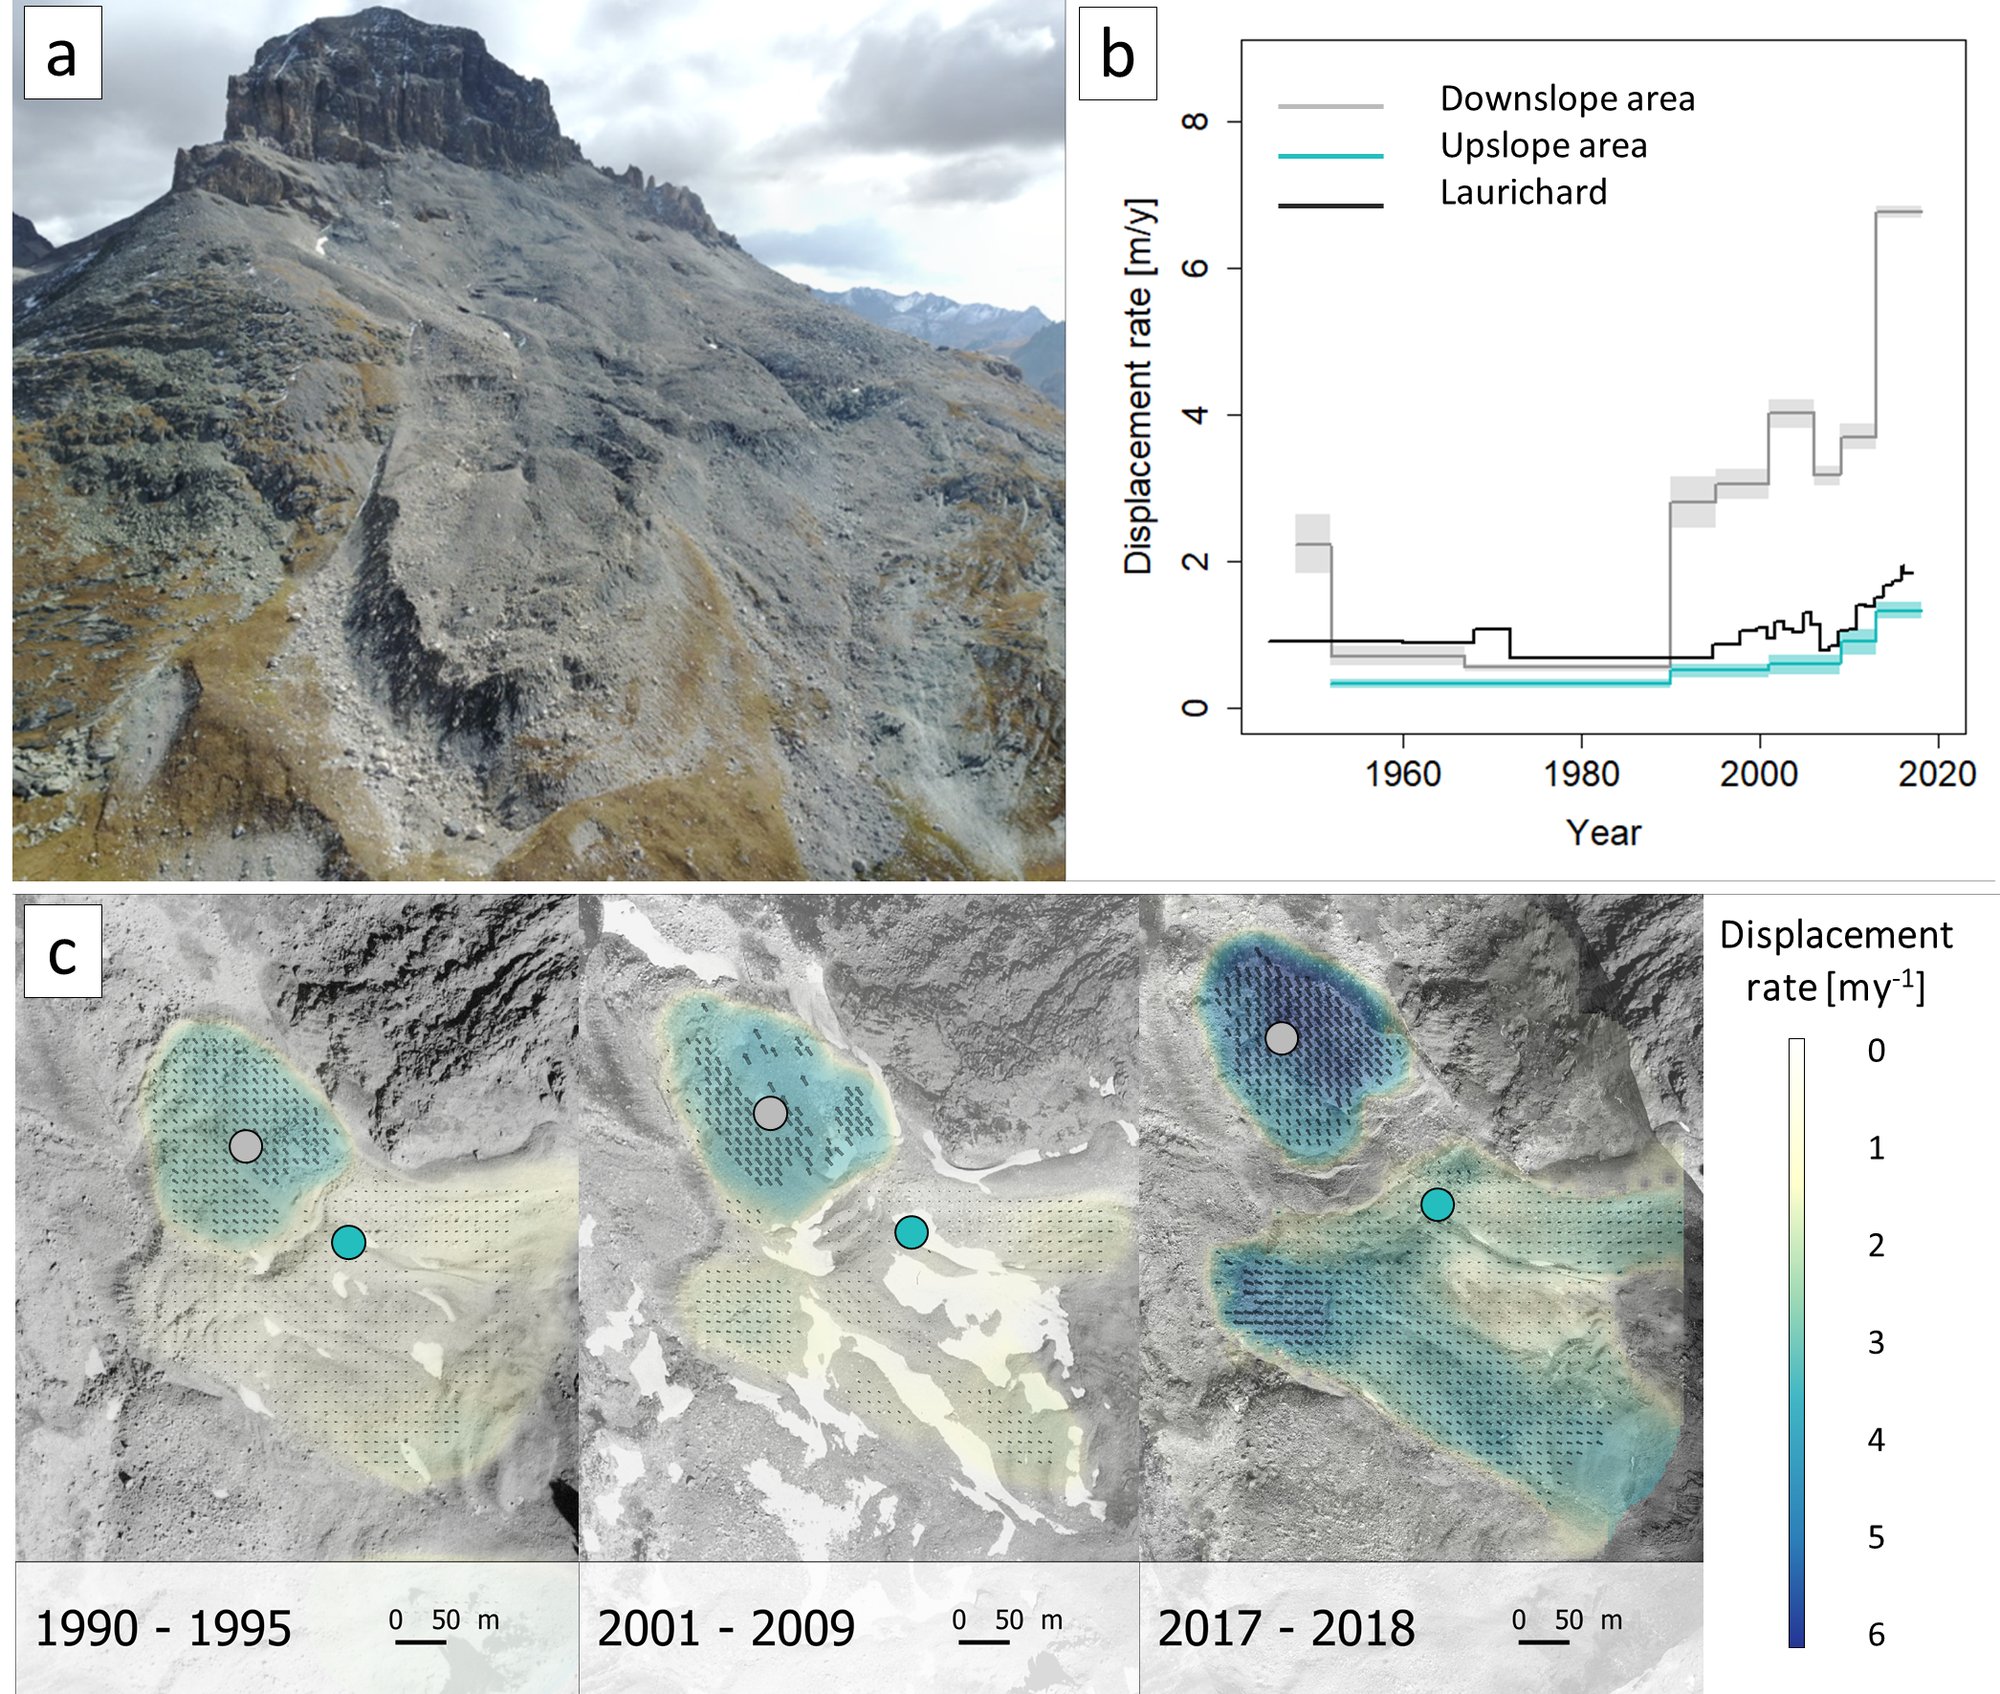
At the regional scale, median displacement rates roughly doubled between the first and second periods (pre/post 1990), then doubled again into the third (2008-2017). The trend closely tracks mean annual air temperature: the French Alps warmed by approximately +0.4 C per decade between 1960 and 2020.
Site investigations: back to Lou
The regional programme closed at the site scale that opened it. Field investigations at the Lou rock glacier in 2015 to 2019 combined UAV photogrammetry, differential GPS surveys, meteorological analysis, and electrical resistivity tomography (ERT) to characterize the internal structure and dynamics of a destabilizing system in detail. Velocity measured by dGPS stakes reached 3-4 m/year on the destabilized lobe, where geophysics showed degrading permafrost conditions. The frontal slope showed incipient tension fractures consistent with impending failure. The August 2015 event fit the pattern: extreme precipitation on a saturated slope that had been weakening for years.
Electrical resistivity tomography (ERT), Col du Lou rock glacier, September 2016.
Lou rock glacier orthophoto time-lapse 2006-2018. The main lobe (centre-right) shows progressive frontal advance and intensifying surface fractures.
The case illustrates how destabilization and debris flow hazard are coupled over different timescales. Decades of accelerating creep modify the landform, raising the predisposition to failure. A meteorological event then activates it. The Lou site was subsequently proposed as a reference monitoring station for permafrost dynamics in the French Alps.
Infrastructure and rockfall: the broader picture
Two companion studies placed the site-scale findings in a wider context of permafrost-related risk. A regional inventory of infrastructure elements (ropeway stations and pylons, mountain huts, access routes) across the French Alps found 352 on thawing permafrost and 147 at high risk. Adaptation strategies were predominantly reactive: most interventions triggered after destabilization had already begun, not through proactive permafrost-aware design.
A parallel study on the Grand Couloir du Gouter, the main hazard zone on the classic route up Mont Blanc, documented rockfall dynamics and climber exposure. It recorded 2,648 rockfall events, with frequency 2.5 times higher during snowmelt than when the couloir was snow-free. Climber traffic averaging 259 passages per day was almost entirely controlled by weather; neither rockfall frequency nor the high accident rate was reflected in behavioral adaptation.
Publications
Rock glaciers throughout the French Alps accelerated and destabilised since 1990 as air temperatures increased
Marcer et al. · Communications Earth & Environment · 2021
Read paper →Rock glaciers in the French Alps: displacement rates and orthoimages of destabilised landforms, 1945-2018
Marcer et al. · PANGAEA (dataset) · 2021
Access dataset →Evaluating the destabilization susceptibility of active rock glaciers in the French Alps
Marcer et al. · The Cryosphere · 2019
Read paper →Permafrost Favorability Index: Spatial Modeling in the French Alps Using a Rock Glacier Inventory
Marcer et al. · Frontiers in Earth Science · 2017
Read paper →Investigating the slope failures at the Lou rock glacier front, French Alps
Marcer et al. · Permafrost and Periglacial Processes · 31, 15-30 · 2020
Read paper →Qualitative risk assessment and strategies for infrastructure on permafrost in the French Alps
Duvillard, Ravanel, Schoeneich, Deline, Marcer, Magnin · Cold Regions Science and Technology · 189, 103311 · 2021
Read paper →Rockfall and vulnerability of mountaineers on the west face of the Aiguille du Gouter (classic route up Mont Blanc, France)
Mourey, Lacroix, Duvillard, Marsy, Marcer, Ravanel, Malet · Natural Hazards and Earth System Sciences · 2021
Read paper →